In High Dimensional Space
2020-05-12
3 minutes
… no one can hear you scream. Actually the party line that gets tossed around is something like,
distances become meaningless in high-dimensions.
Here “high-dimensions” is referring to wide data (observations having a lot of features). “Meaningless” is kind of vague. What really happens is that the distance between near points and the distance between far points in low-dimensional space become approximately equal in high-dimensional space. To put it differently,
the ratio of the distance of near and far points approaches 1 in high dimensions.
So in high dimensions the notion of distance becomes… meaningless. This is a great Stack Overflow post that provides some more detail.
Simulations tend to help me solidify theoretical concepts. So let’s create some fake data where two points are close to one another and two points are far apart, and see what happens to the ratio of distances between these points as we add dimensions to data. The code for the results provided below is available here.
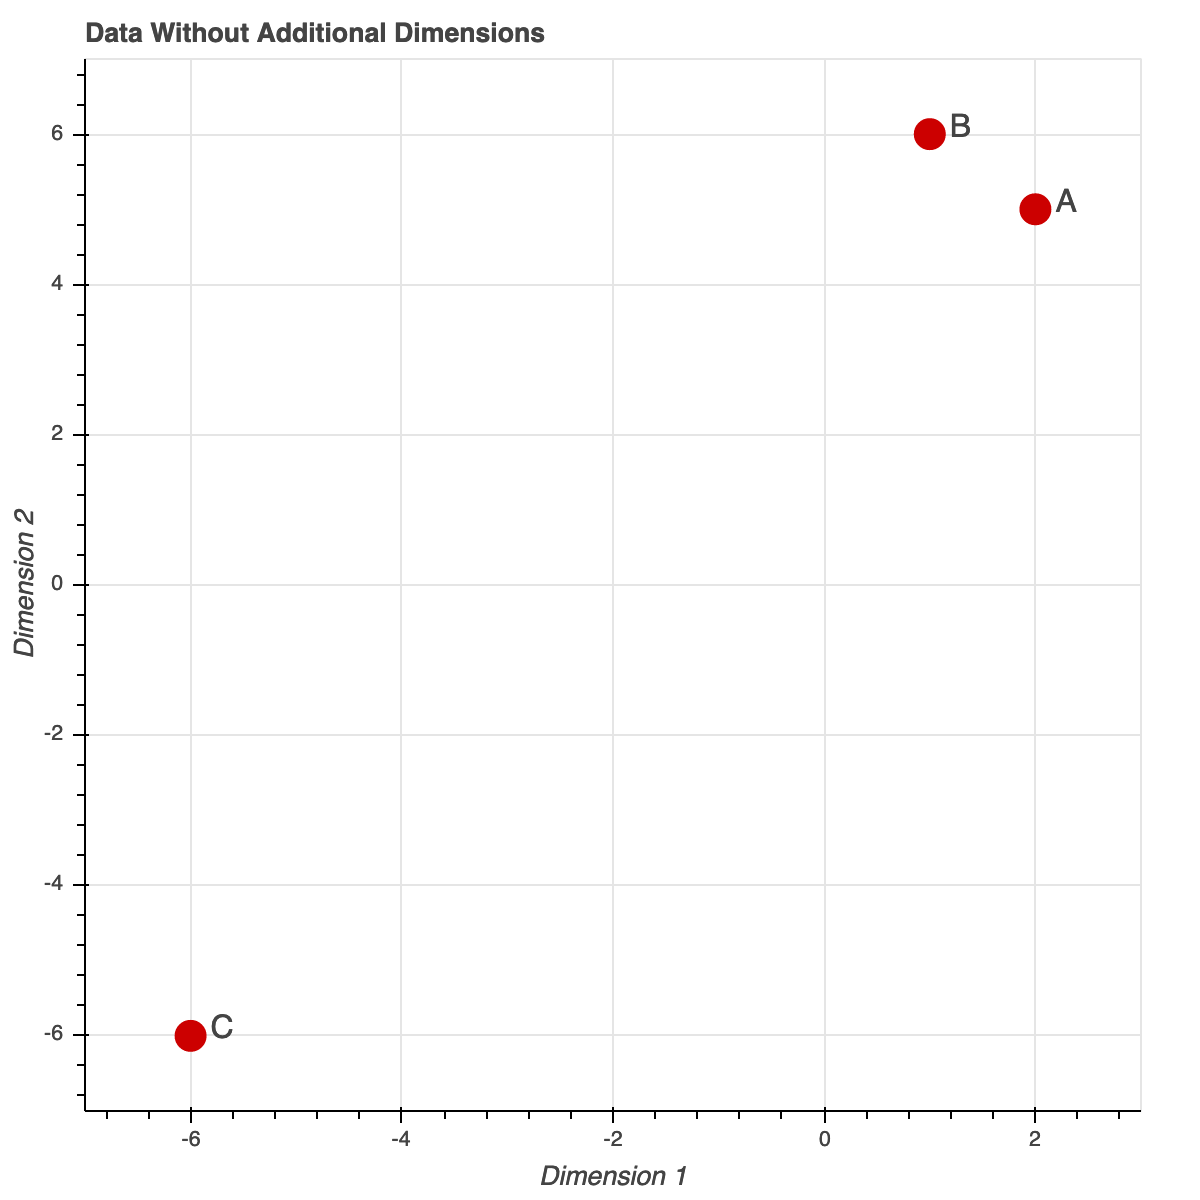
Below is a plot of three points: A = (2,5), B = (1,6), and C = (-6,-6). In this low dimensional space point A is close to point B but far from point C.
The distance measurement we are referring to is Euclidean distance. One way to compute it in Python is,
import numpy as np
def euclidean_distance(x,y):
  x = np.array(x)
  y = np.array(y)
  result = np.linalg.norm(x-y)
  return(result)
We’re interested in the ratio between the distance of point A to point B and point A to point C. We also want to know how this ratio changes when we include dimensions to these observations. So for each additional dimension we calculate and store this distance ratio. Since we’re using fake data we add random dimensions (drawn from the normal distribution). 58 new dimensions are generated which gives us 60 dimensions in total. This result is simulated 500 times to make sure that our inference on the distance ratio result is stable, and not due to random chance.
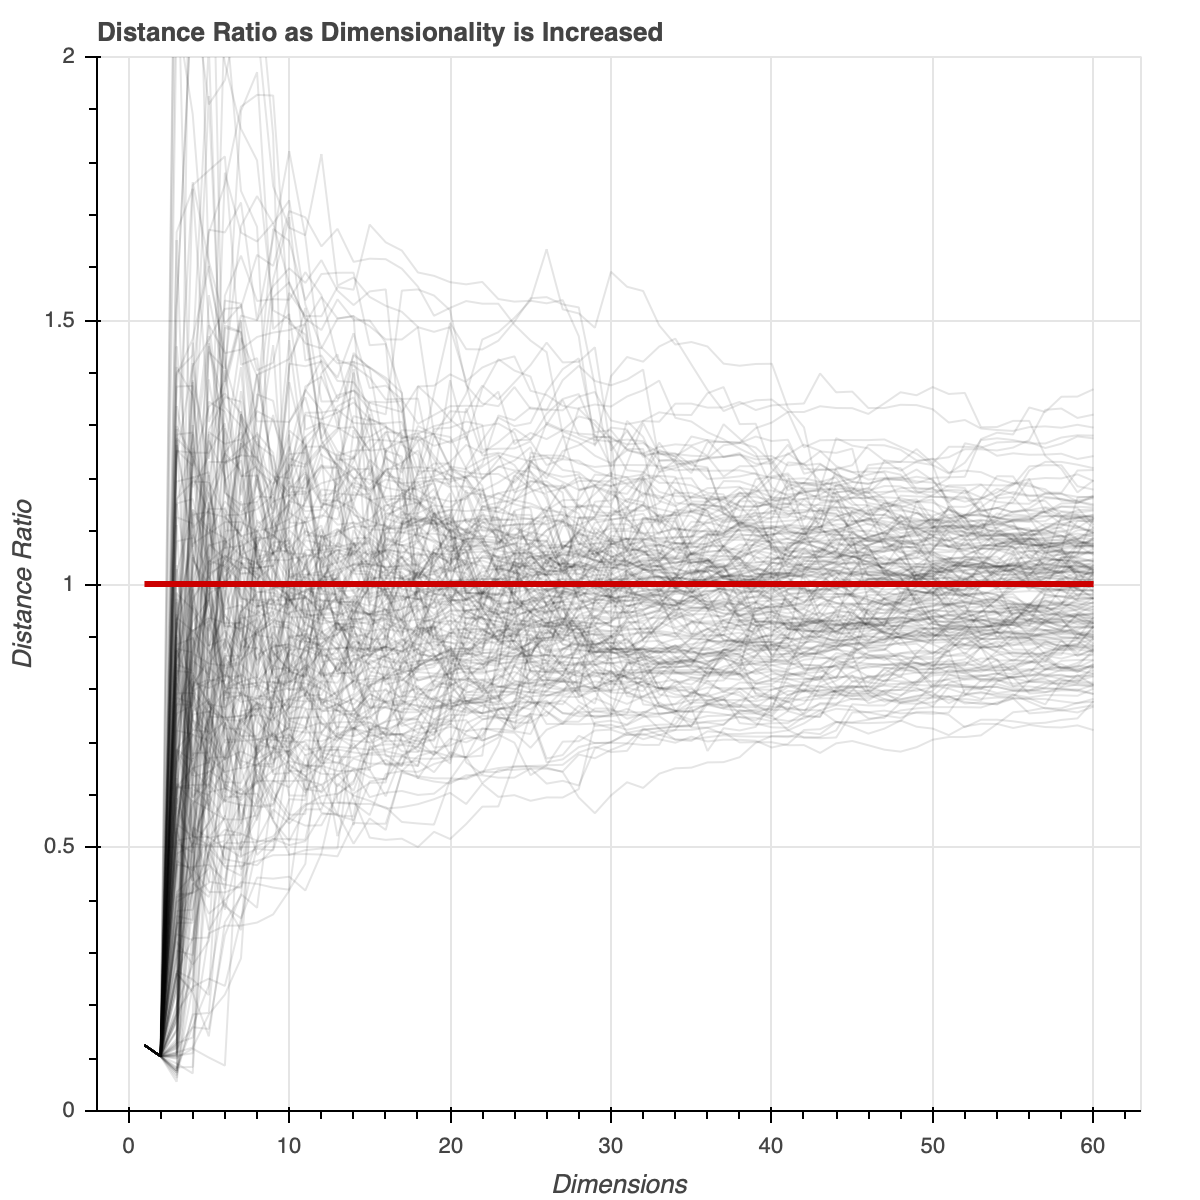
Below is a plot of all the distance ratio calculations for a sample of the simulations. As a higher dimensional space is considered, the distance between near and far points become more similar. The distance ratio tends towards 1.
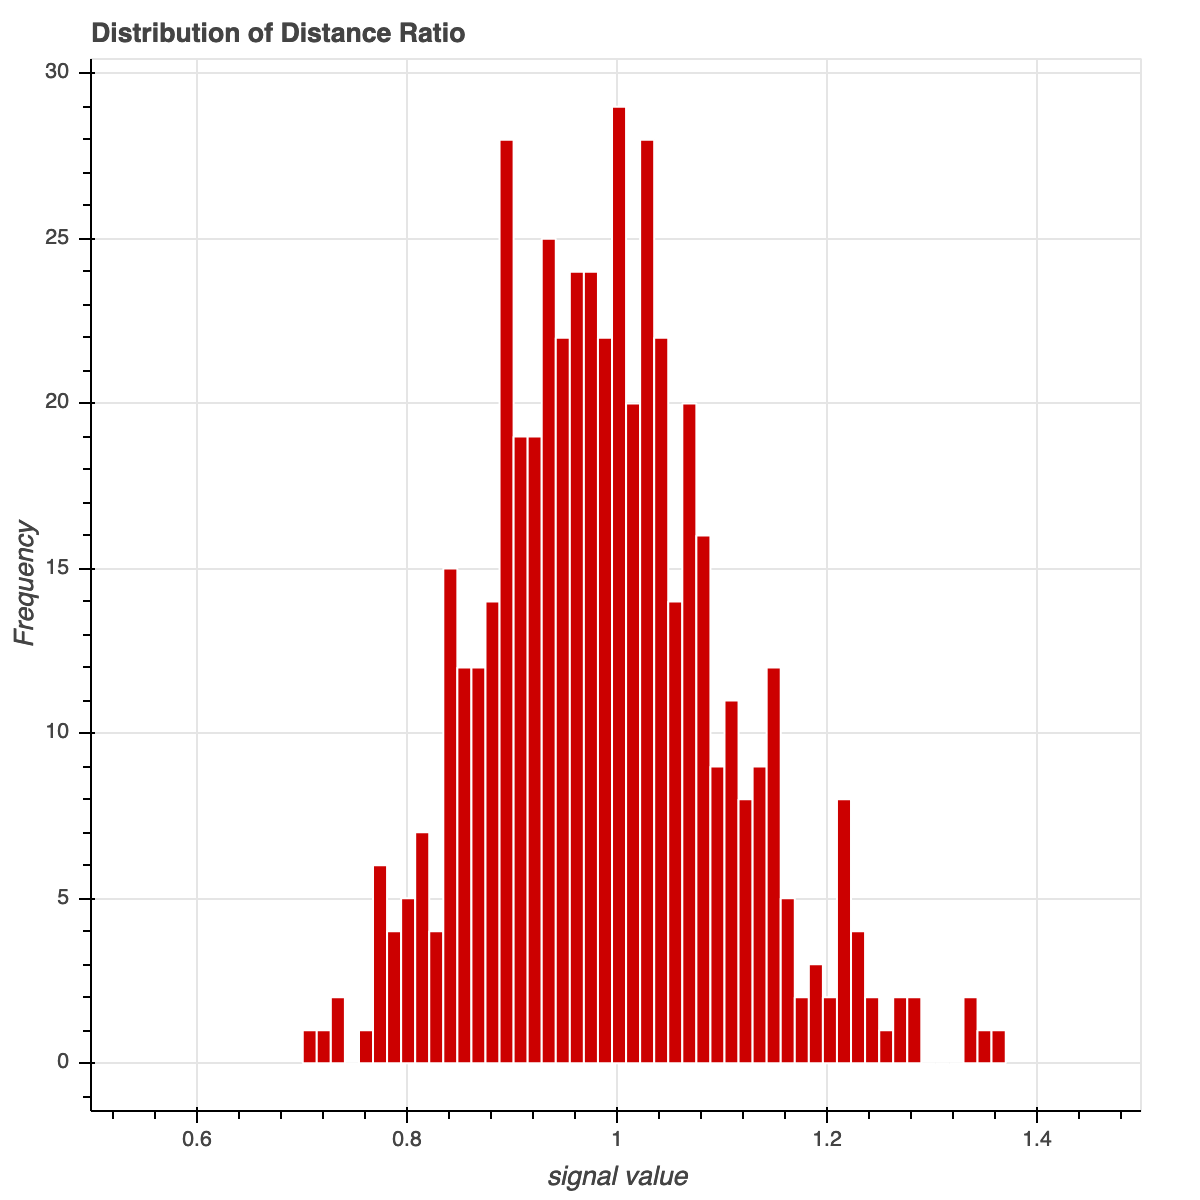
To make things more convincing we plot a histogram of the final distance ratio (calculated using all 60 dimensions). These final ratios are centered around 1, confirming the concern with distance being meaningless in high dimensions (recall that in two dimensions point A is closer to B than C).
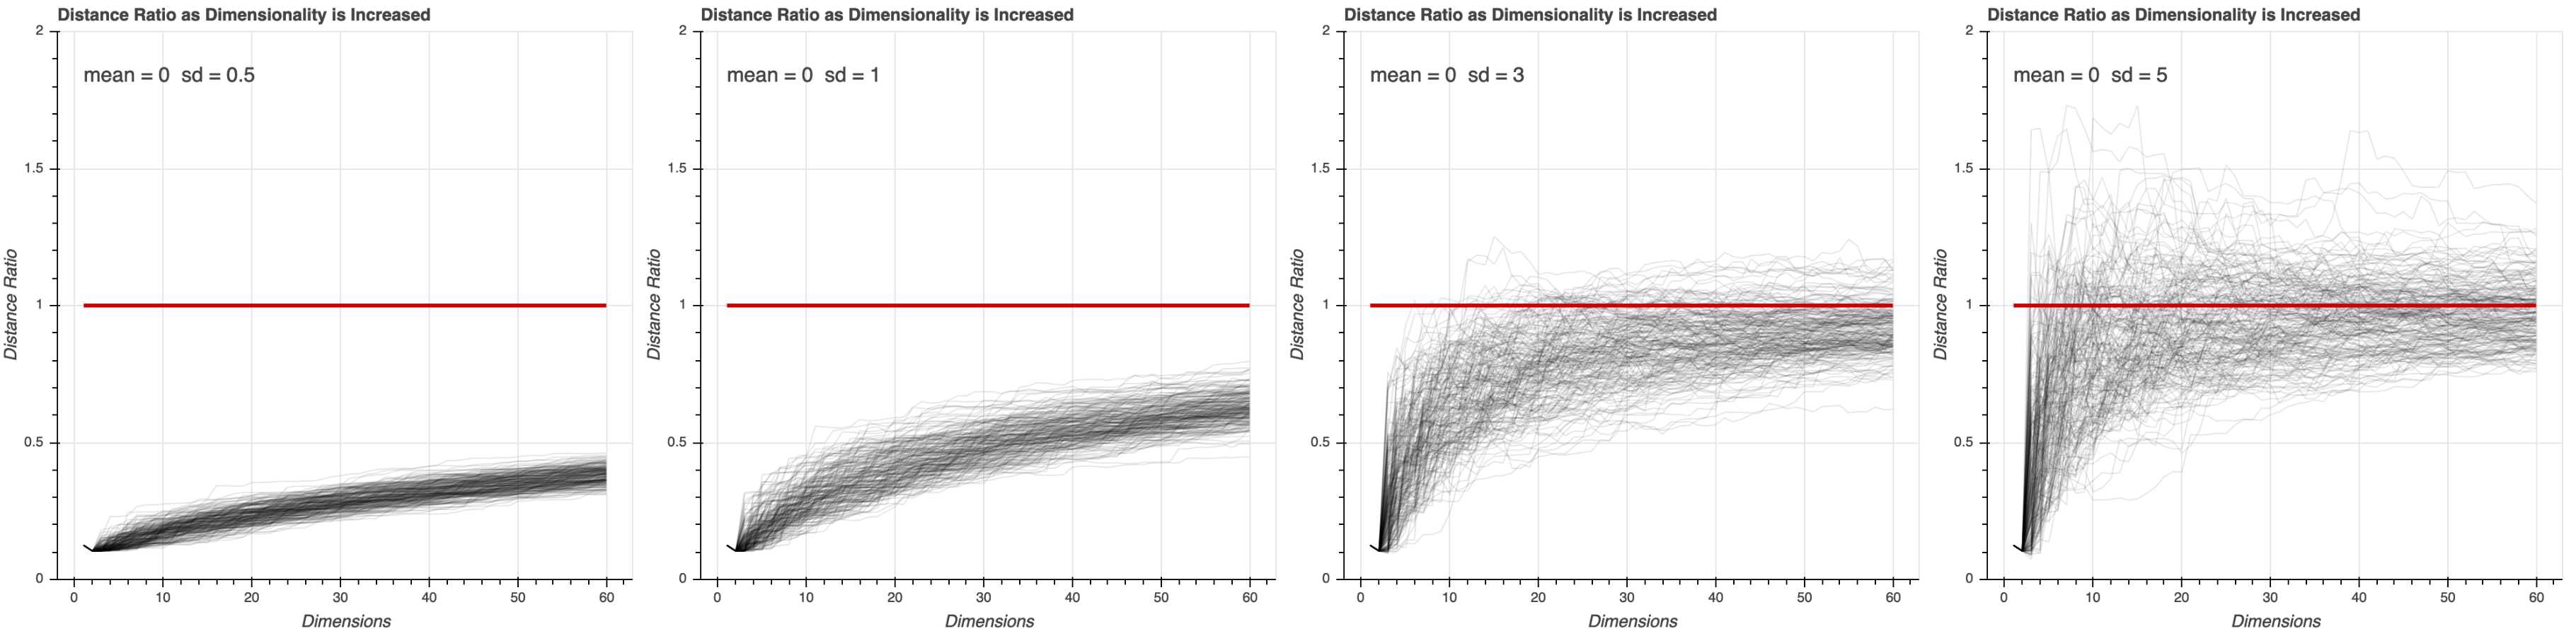
It would be interesting to see if this result changes as we change the variation in the data. Below we run the same simulations with different standard deviation values (0.5,1,3,5) when generating the additional dimensions. With a higher standard deviation we reach a distance ratio of 1 with fewer additional dimensions than with a lower standard deviation. So the higher the variability in the additional dimensions the more sensitive distance is to becoming meaningless as we add dimensions.
So it’s pretty clear that the concept of Euclidean distance does not hold up in high dimensions. And this is exacerbated if there is a lot of variation in the data. PCA, t-SNE, neural network embeddings, or other dimensionality reduction techniques will help reduce the dimensions of the data you are working with while preserving the relevant information, allowing you to work with Euclidean distance more appropriately.
563 Words